

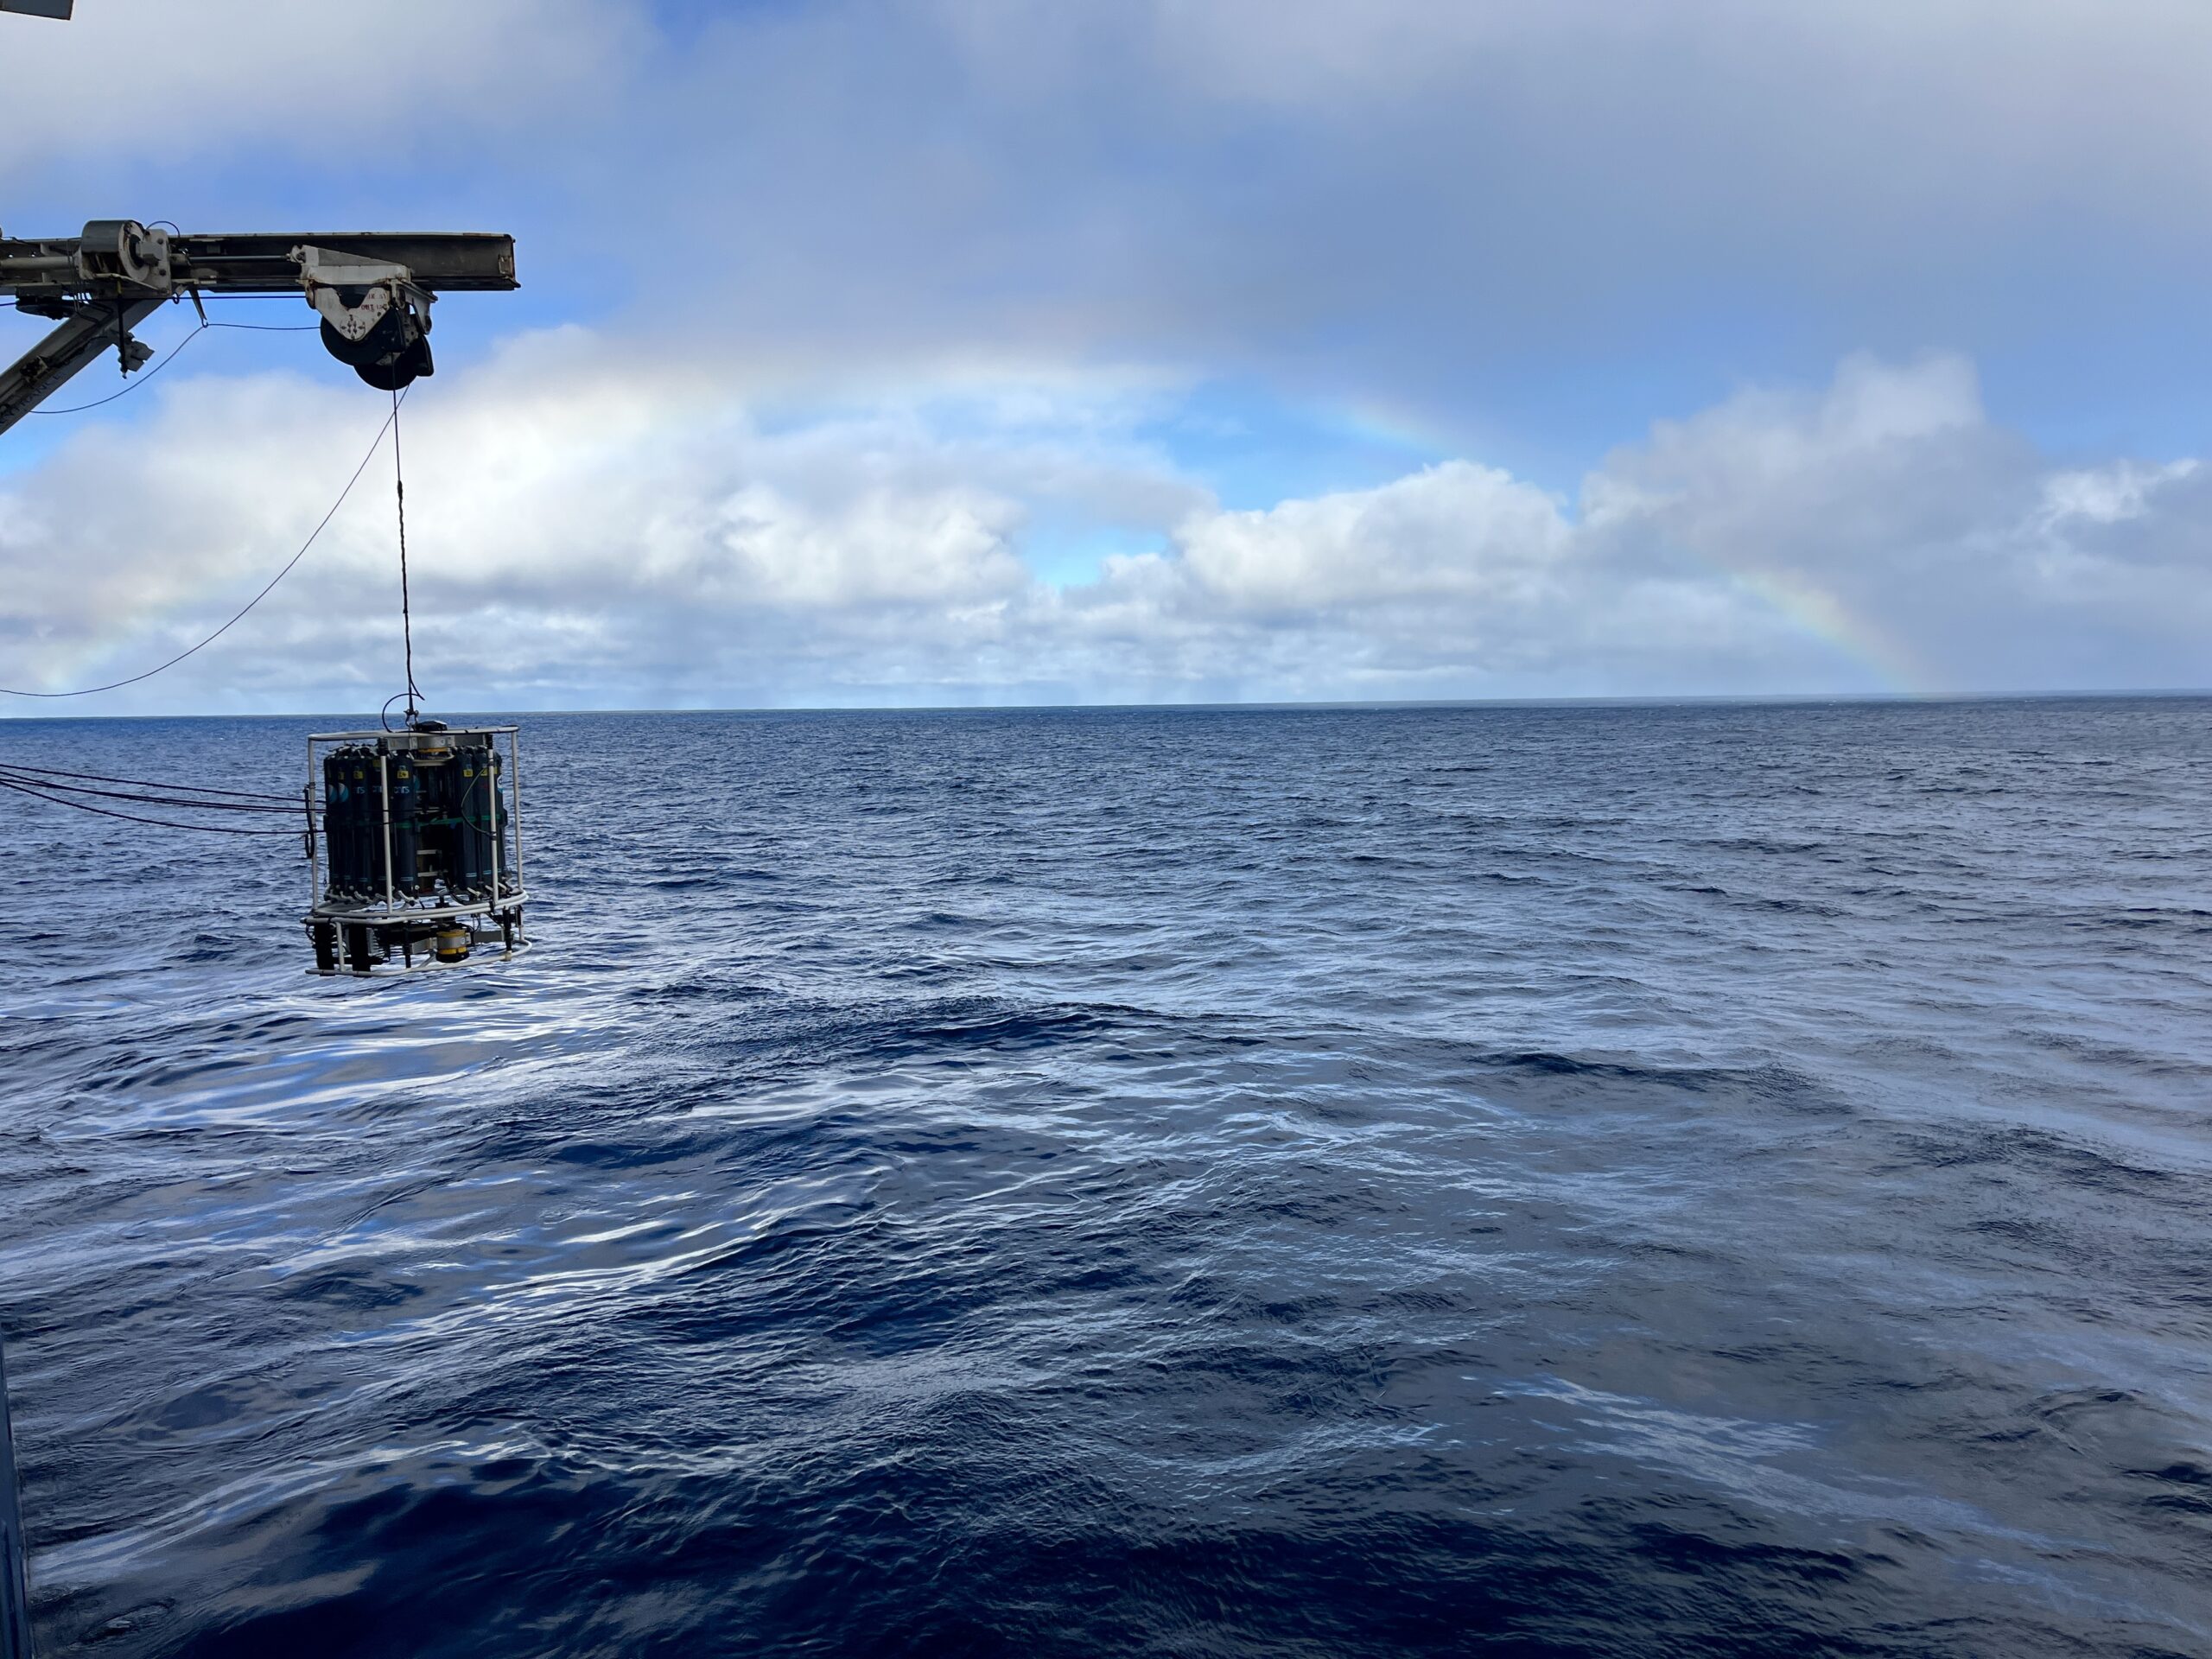
During the WHIRLS cruise, we spend a lot of time collecting seawater samples specifically to understand the hidden chemistry story behind CO2 absorption and ocean acidification. Which brings us to three main measurements: DIC, alkalinity and pCO2.
The atmosphere is full of CO2 and the ocean surface is in contact with the air, so CO2 constantly moves back and forth between them, trying to reach a balance. When we burn fossil fuels, we push more CO2 into the atmosphere, and the ocean absorbs a large share of it. This helps slow down climate change, but it comes at a cost to the ocean itself, which is what we’re trying to track.
DIC: Dissolved Inorganic Carbon – simply the total amount of carbon dissolved in a sample of seawater, no matter the chemical form. When we collect water from the Niskin bottles at different depths, we’re checking how the carbon load changes. Near the surface, phytoplankton (tiny marine plant-like organisms) are constantly using CO2 to grow, through photosynthesis, resulting in a dip in DIC where life is most active. Deeper down, dead organic material sinks and gets broken down by bacteria, releasing CO2 back into the water, so DIC tends to increase again in deep water. Measuring DIC at every depth basically lets us watch this cycle of carbon being taken up near the surface and released again below.
Alkalinity: When CO2 is dissolved in seawater, the pH lowers and thus the water becomes more acidic. However, in the ocean, some elements (mostly related to carbon) are able to neutralise incoming CO2 and so the water’s acidity doesn’t spike right away. The higher the alkalinity, the bigger this “sponge” effect is. This matters enormously for climate science. Alkalinity essentially determines how much of an effect a given amount of absorbed CO2 is going to have. Two water masses can have exactly the same amount of dissolved carbon, but the one with lower alkalinity will be noticeably more acidic, simply because it has less buffering capacity left. Acidification of the ocean causes a corrosive environment that dissolves the calcium carbonate shells of marine life (corals, oysters, etc.) and impairs fish navigation.
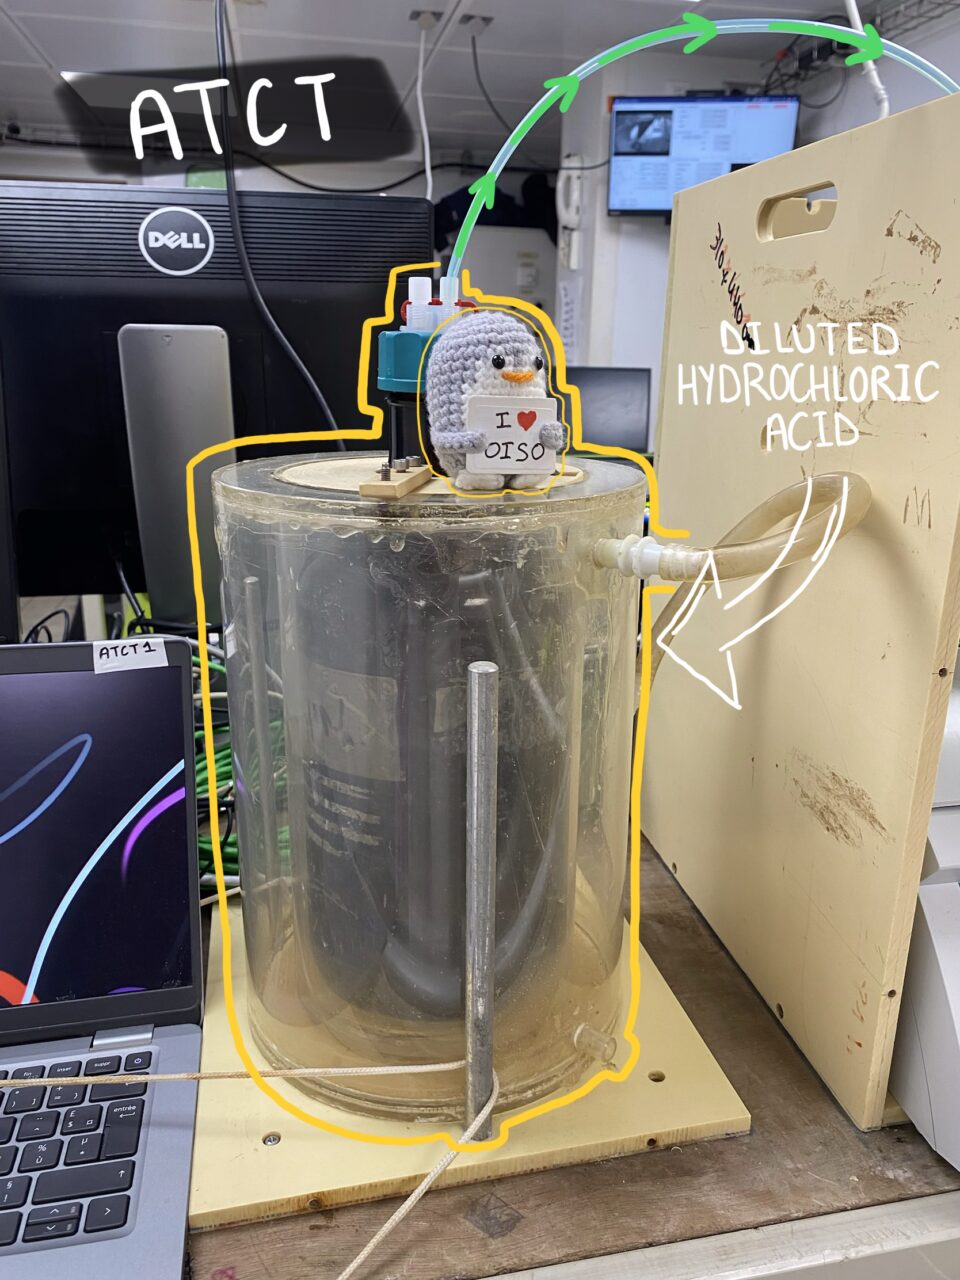
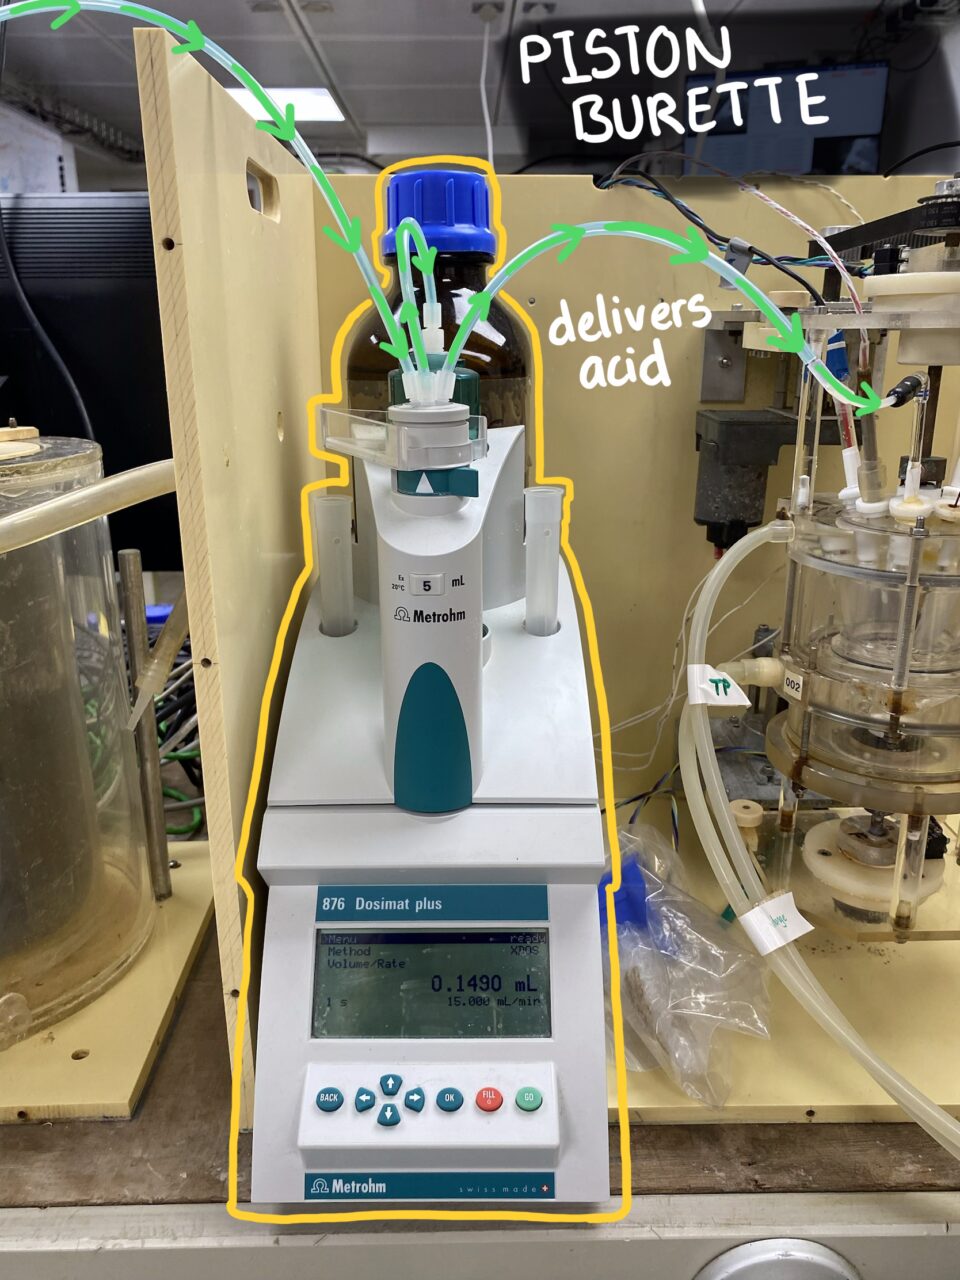
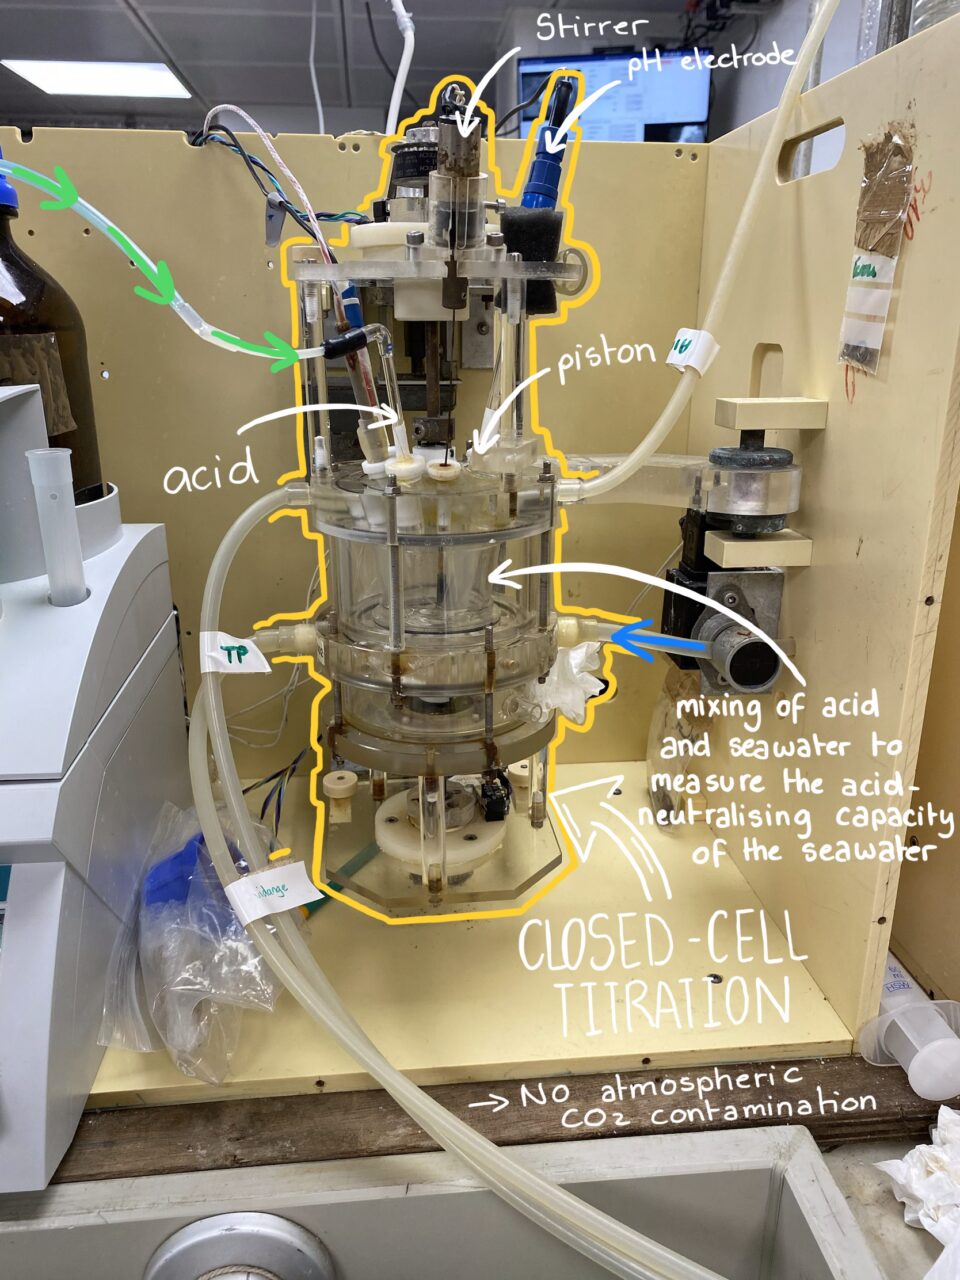
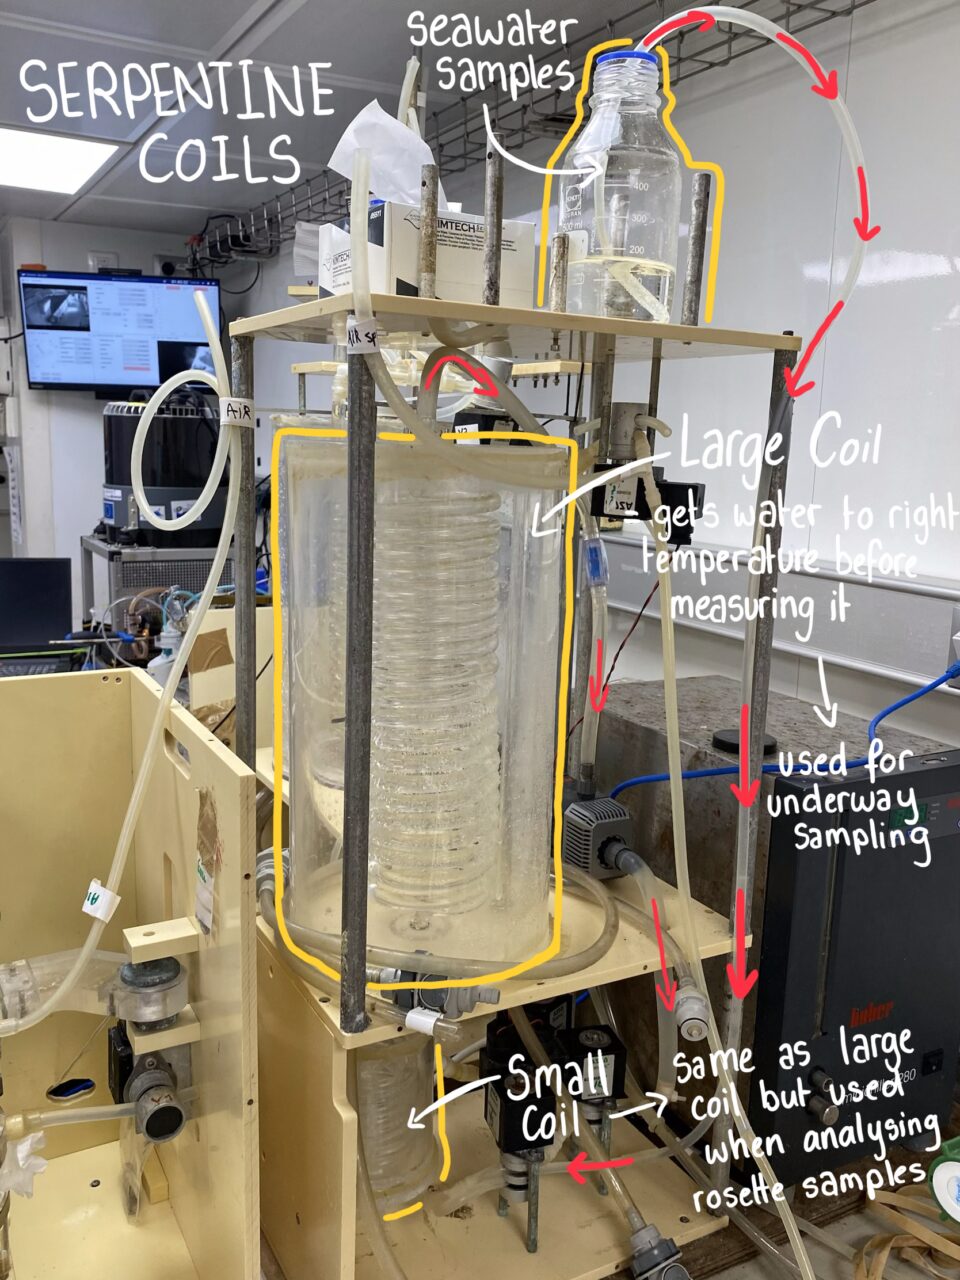
Every CTD cast, we collect one bottle of water per depth between 1200m and the surface (usually 21 bottles across the water column) and run them through a machine that performs a very precise, slow titration: it adds a measured trickle of acid to the sample and continuously tracks how the acidity responds (see photos A – D for ATCT). From the exact shape of that response curve, the instrument can calculate both DIC and alkalinity from a single run.
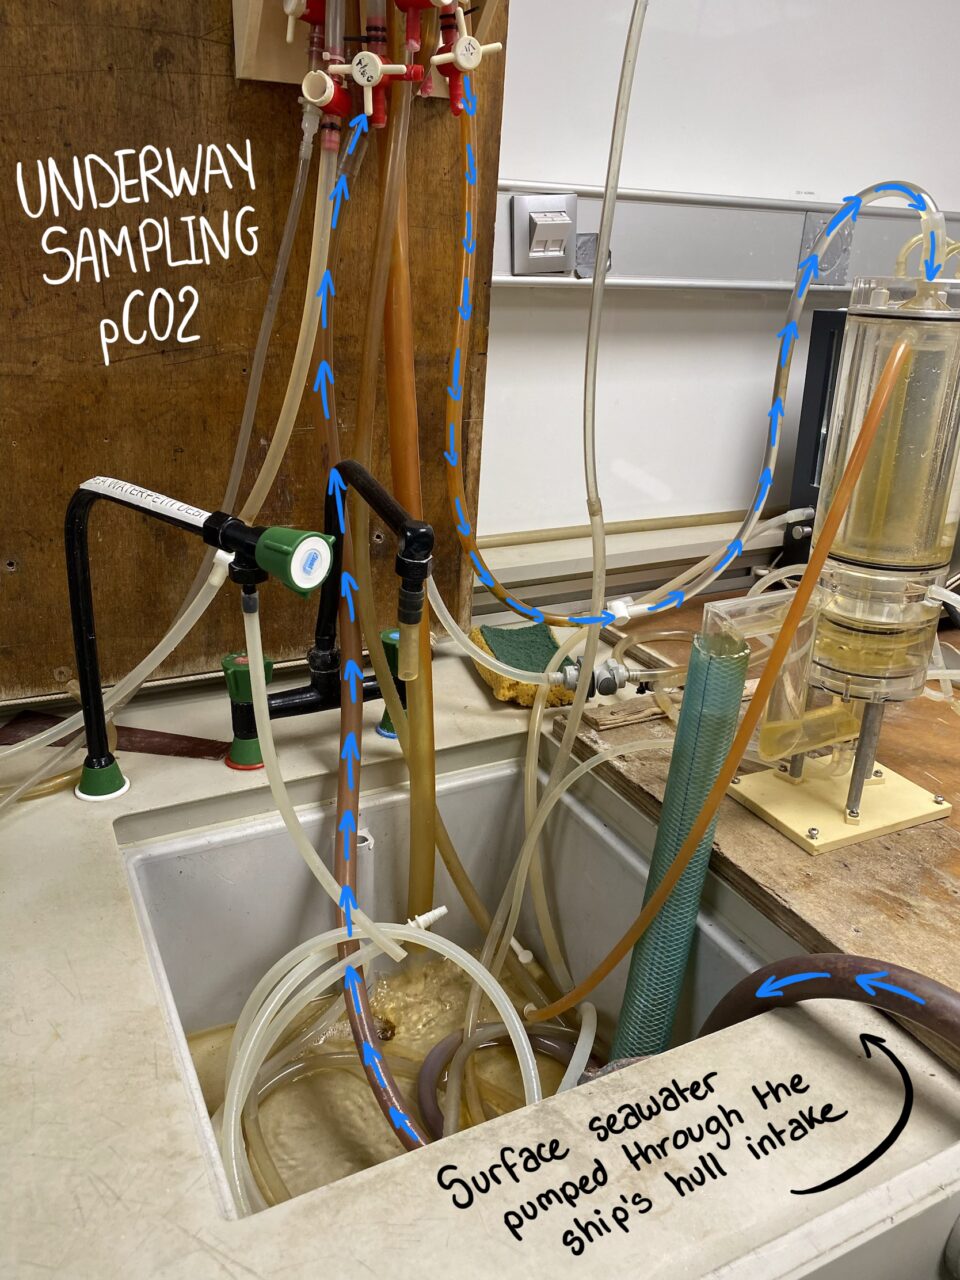
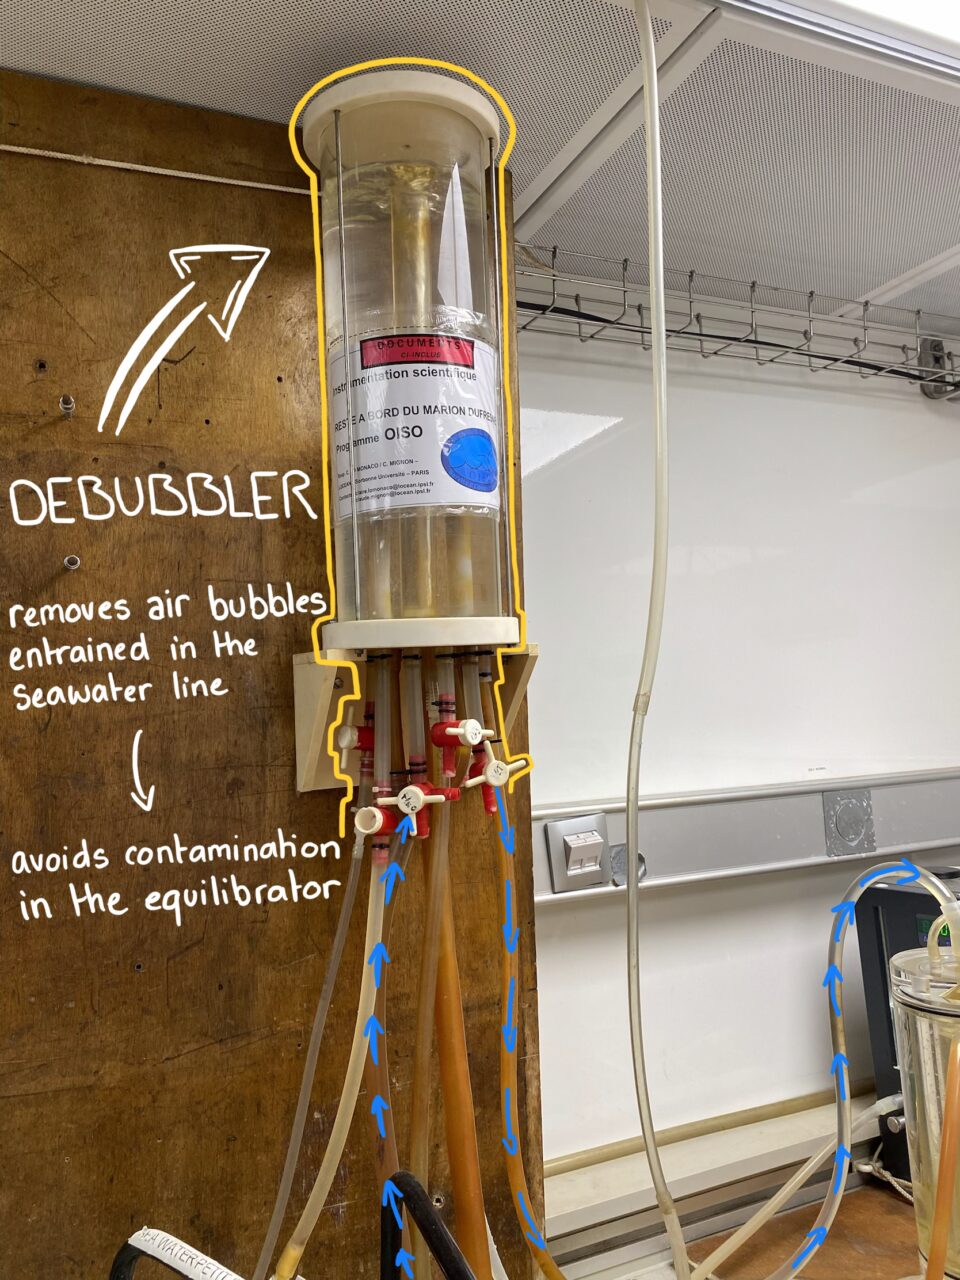
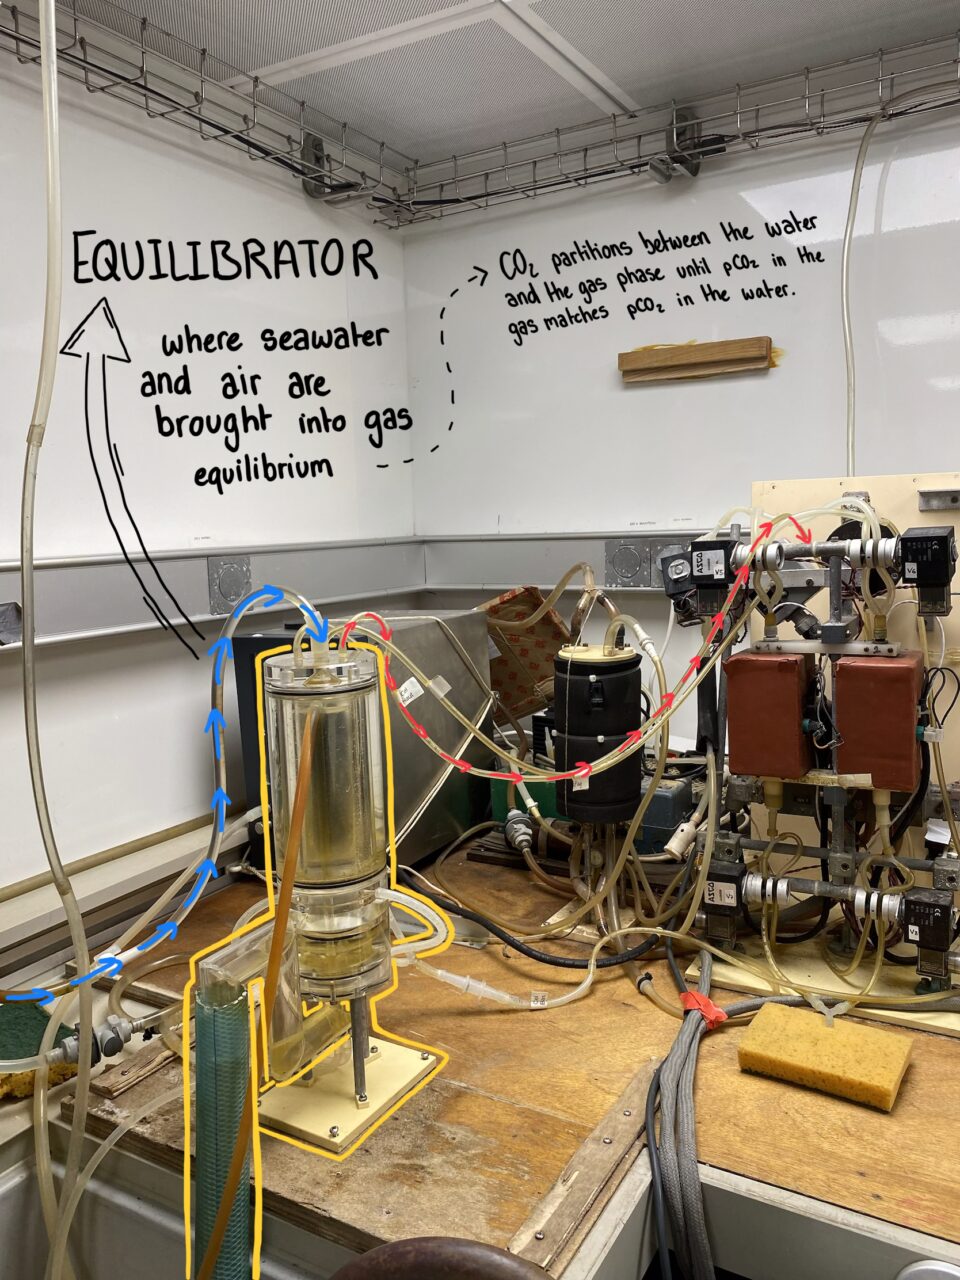
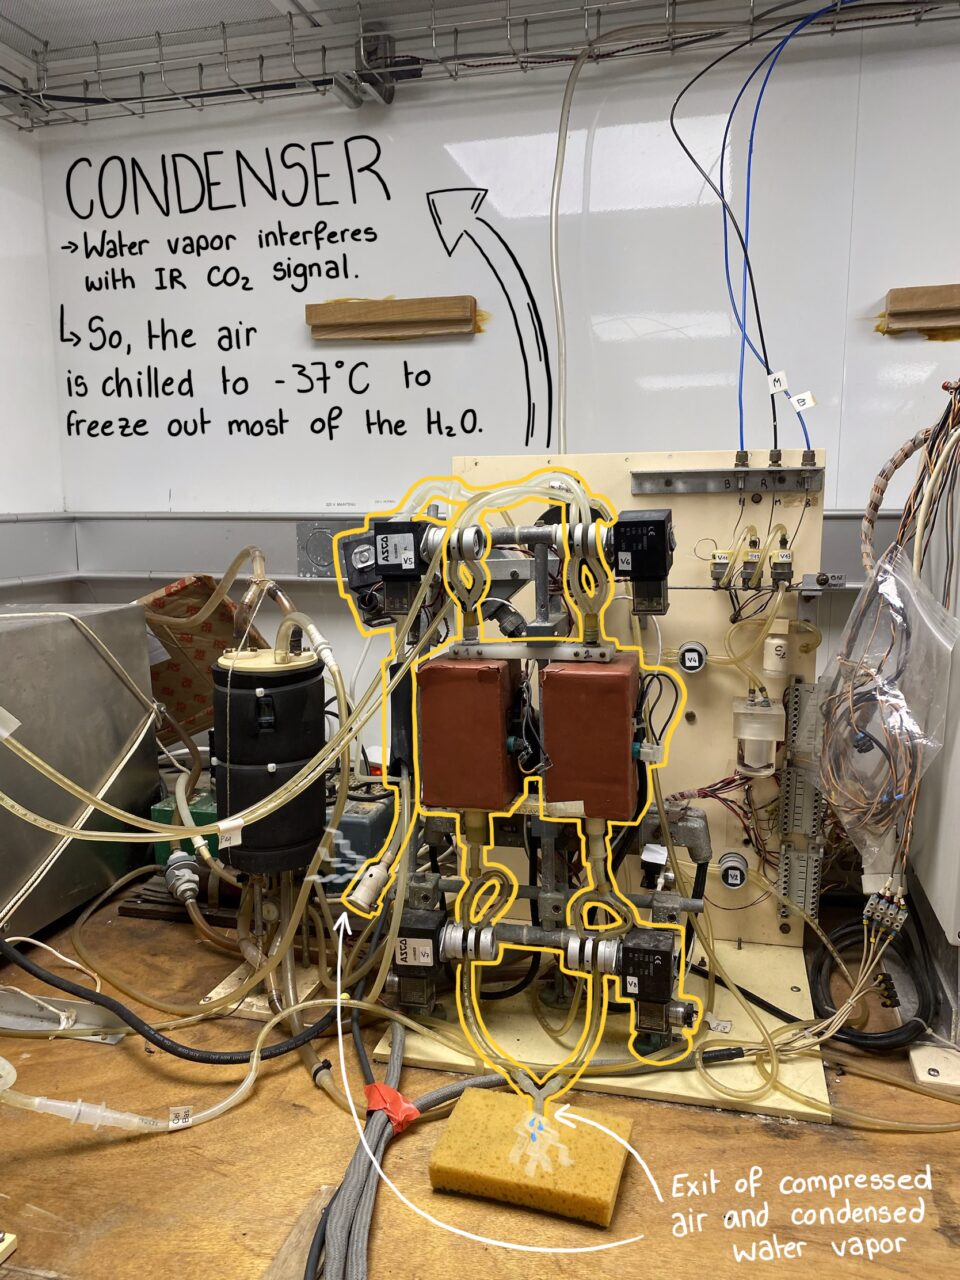
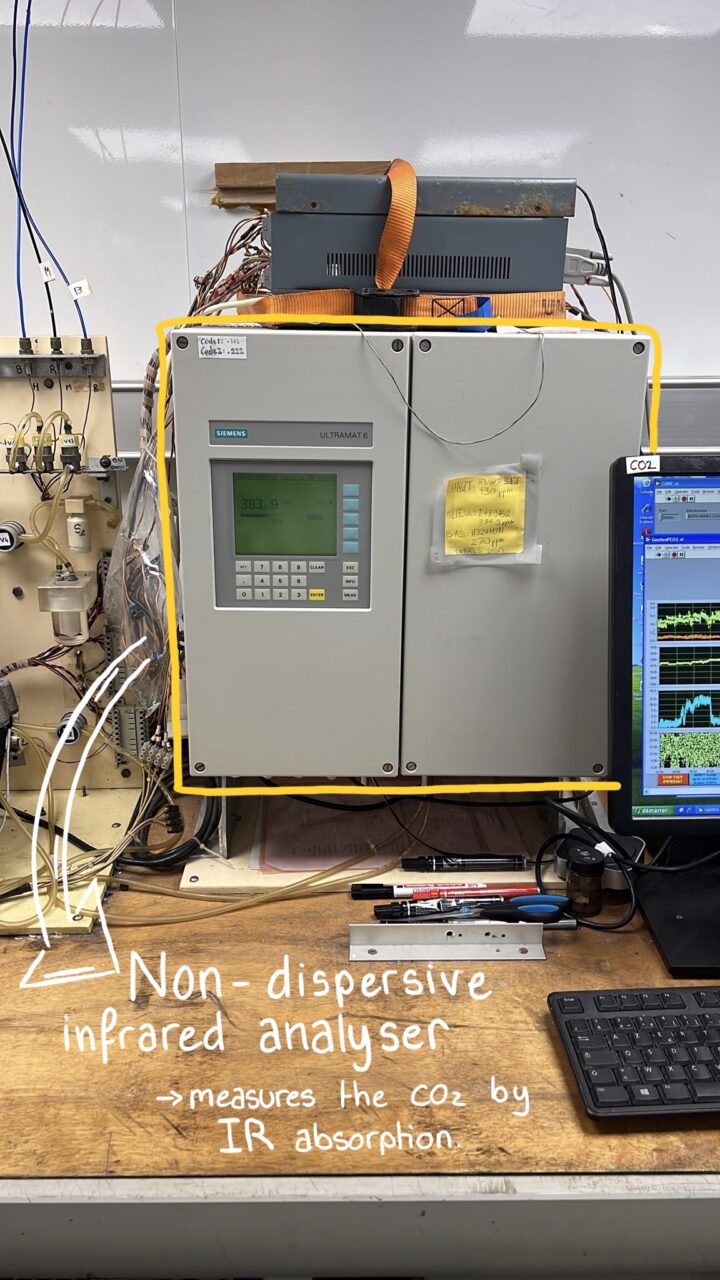
pCO2: Alongside DIC and alkalinity, we also run a separate instrument that continuously measures pCO2, the partial pressure of CO2 in the surface water, which is really just a way of expressing how much “pressure” the CO2 dissolved in the water is exerting, compared to the CO2 in the air right above it. (See photos 1 – 5 for pCO2).
If the CO2 pressure in the water is higher than in the air, the ocean will release CO2 into the atmosphere. If it’s lower, the ocean will absorb CO2 from the air. Measuring pCO2 continuously as the ship moves lets us map out, in real time, where the ocean is currently acting as a carbon source and where it’s acting as a carbon sink.
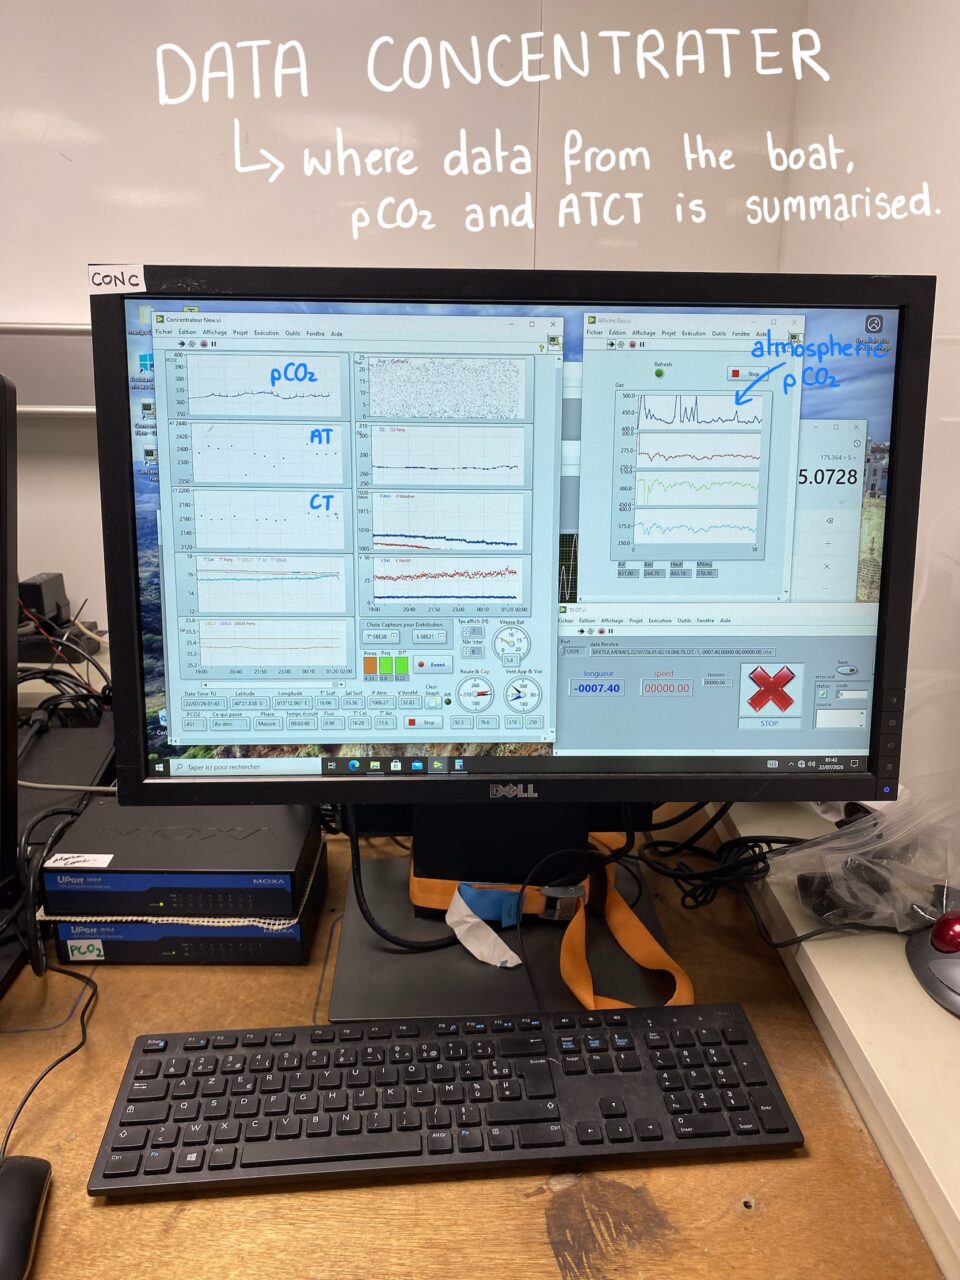
Combined, these three measurements, let us reconstruct the ocean’s carbon chemistry in real detail: how much CO2 it has already absorbed, how much more it can take before becoming significantly more acidic, and how that exchange with the atmosphere is playing out today. That’s the puzzle we’re piecing together, one bottle and one titration at a time. (See photo 6 for summarised data).
Author and informational photos: Nelmari Reinecke
Team: Claire Lo Monaco, Liam Gregoire, Audrey Minière, François Guegueniat, Paul Hargous, Nelmari Reinecke