

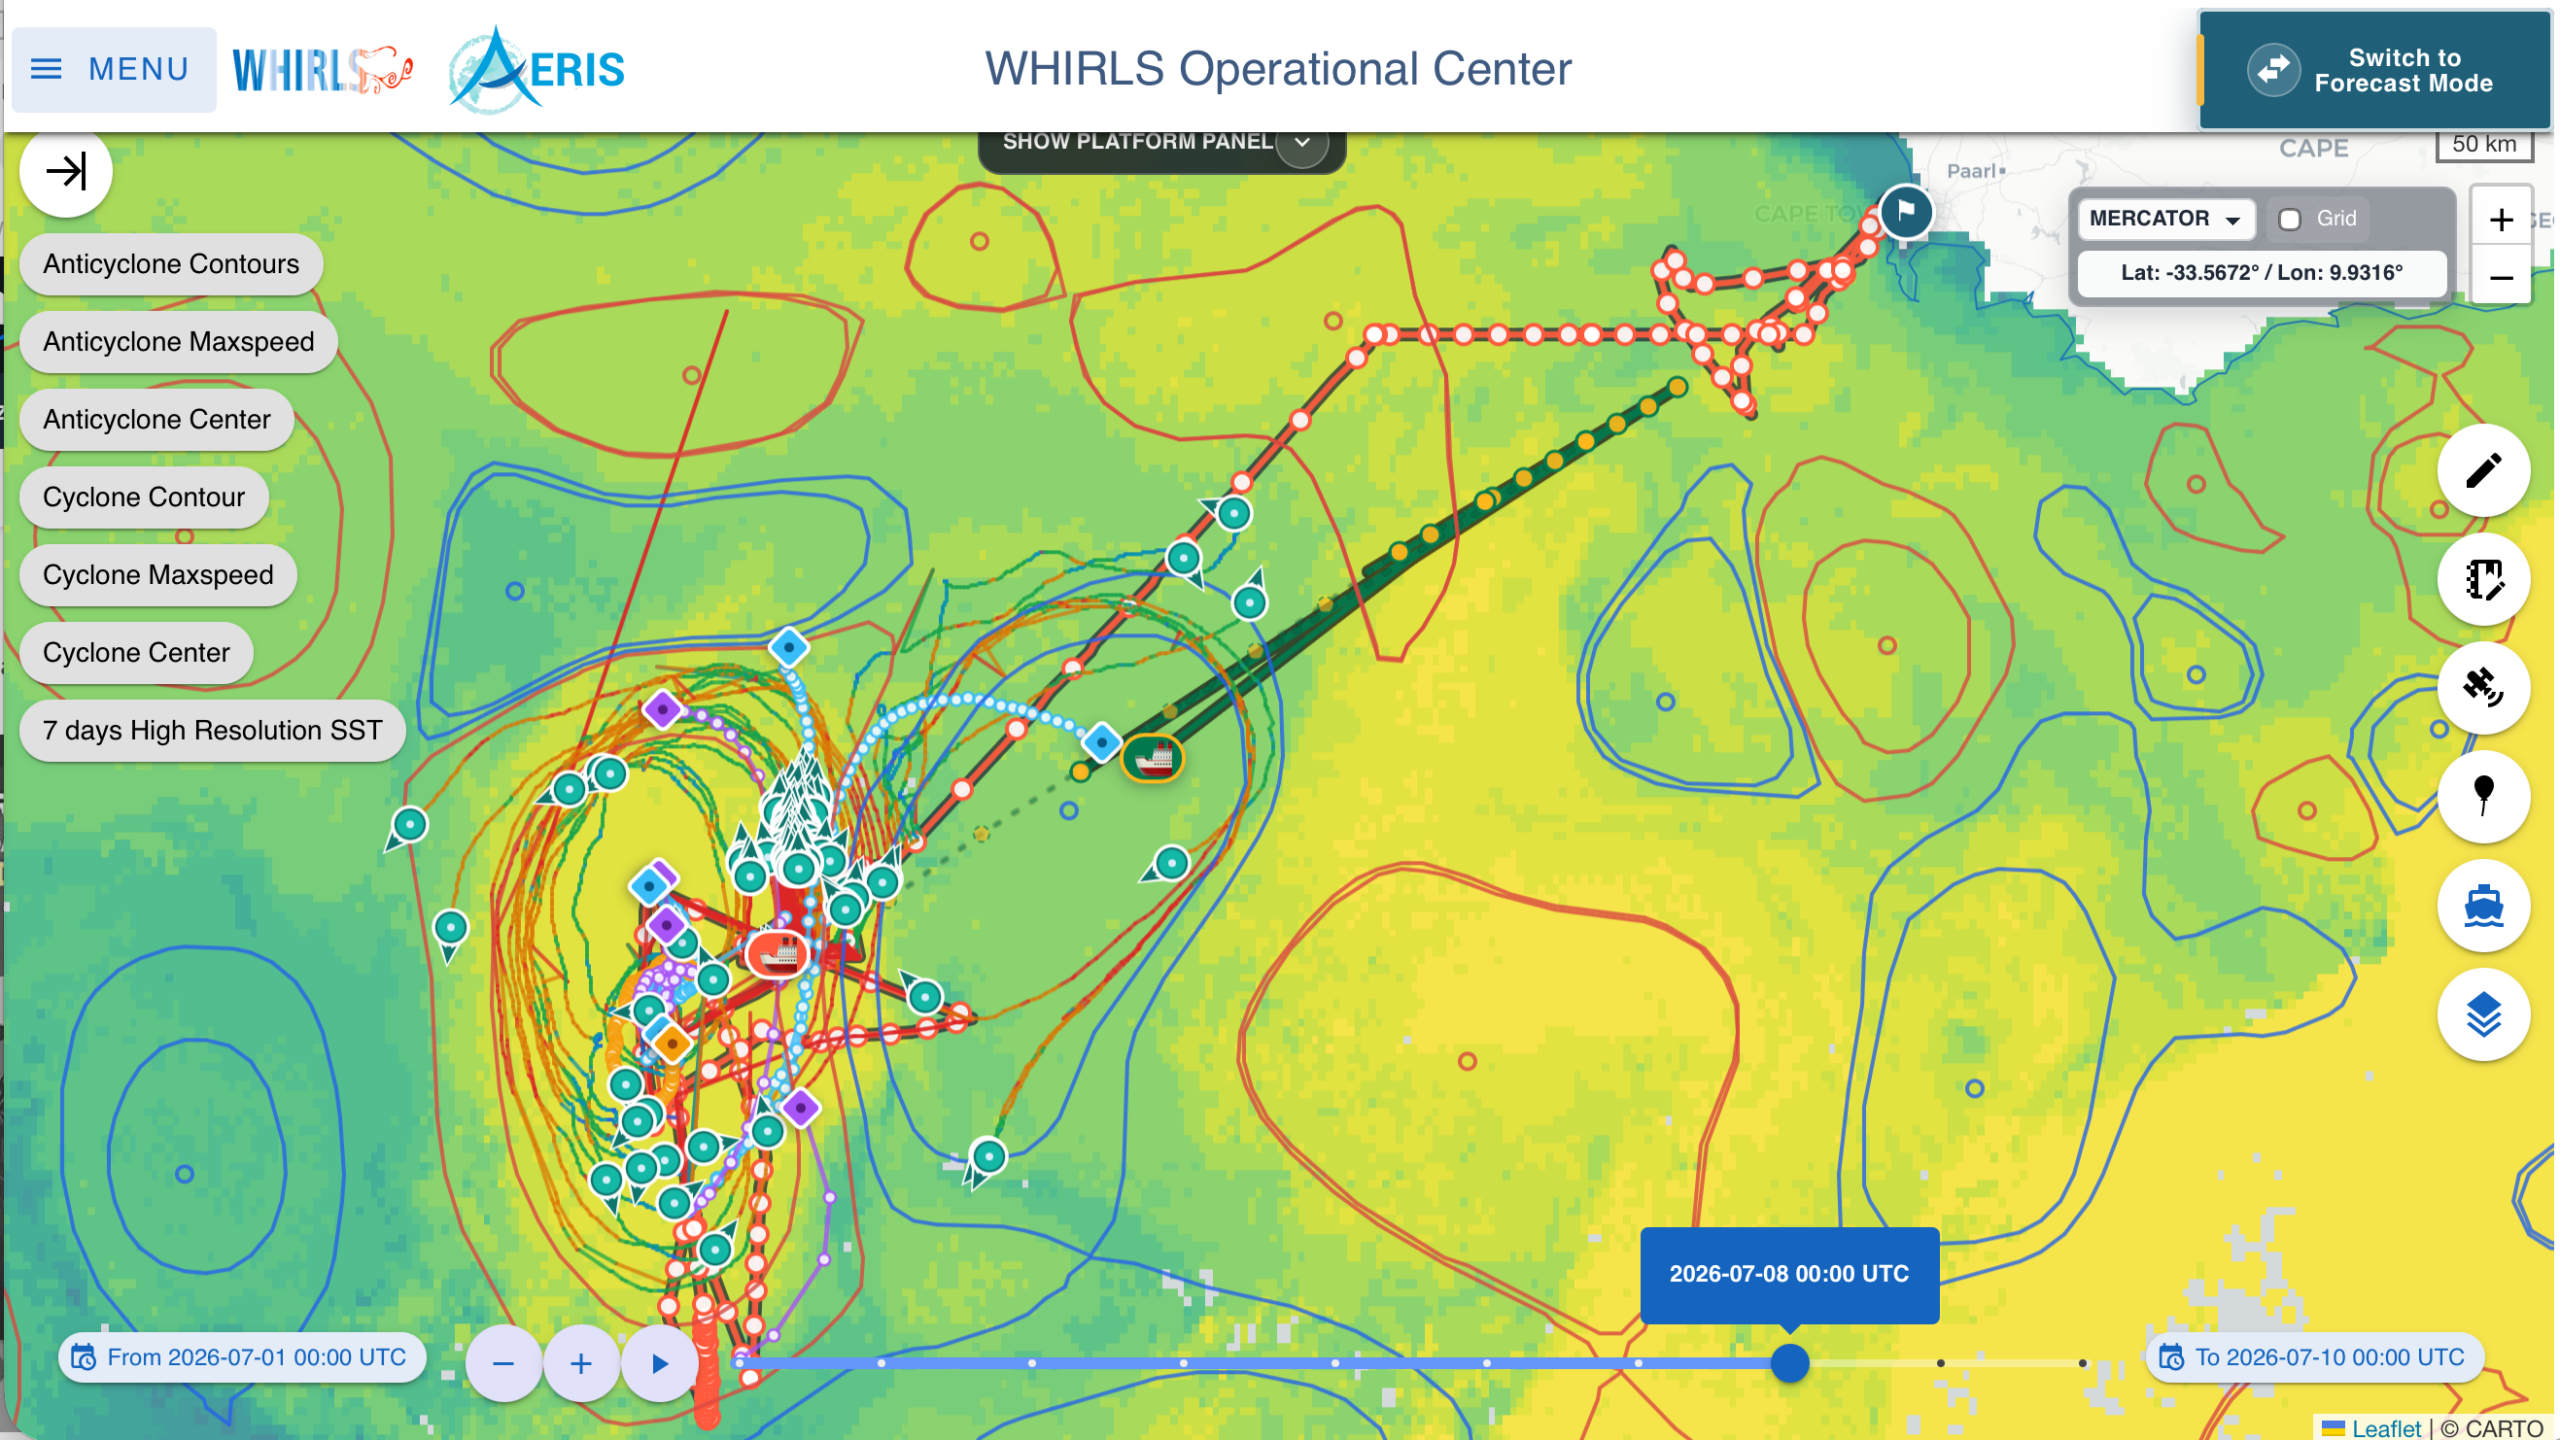
When two research vessels and a swarm of autonomous robots set out into the Agulhas Current this southern-hemisphere winter, they faced a familiar problem in ocean science: the sea does not sit still. The eddies, fronts, and filaments that WHIRLS was built to study move, spin, merge, and decay over days. To sample them, you first have to find them, and then you have to reach them before they change. That is the job of the WHIRLS operational center.
The center is a live “eyes on the ocean” platform that we assembled to guide the WHIRLS field campaign in real time. It brings together, in a single interactive map, the many streams of information a chief scientist needs to decide where the ship should go tomorrow morning. It was built with the support of the ODATIS and AERIS data and service centers of the French Data Terra research infrastructure, whose expertise in ocean and atmosphere data made it possible to pull so many sources into one coherent, continuously updated view.
Our own analyses of the flow. At the heart of the platform are the analysis products developed within our team. TOEddies, an eddy detection and tracking algorithm applied to satellite altimetry, identifies the mesoscale eddies in the region, follows them day by day, and captures the merging and splitting events that make an Agulhas Ring’s life so rich. Alongside it, FTLE (Finite-Time Lyapunov Exponents) reveal the transport barriers and stirring pathways in the surface flow, showing where water masses are being drawn together or pulled apart. Together these tell us not just where the eddies are, but how the surrounding ocean is organizing itself around them.
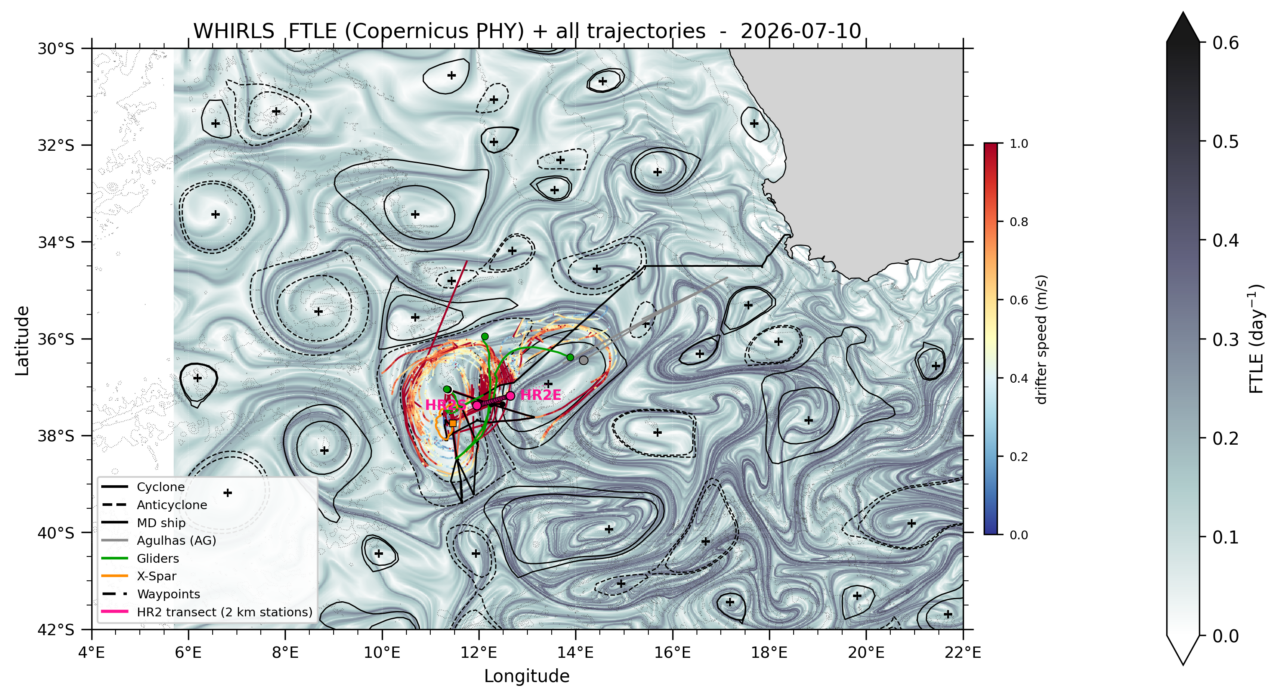
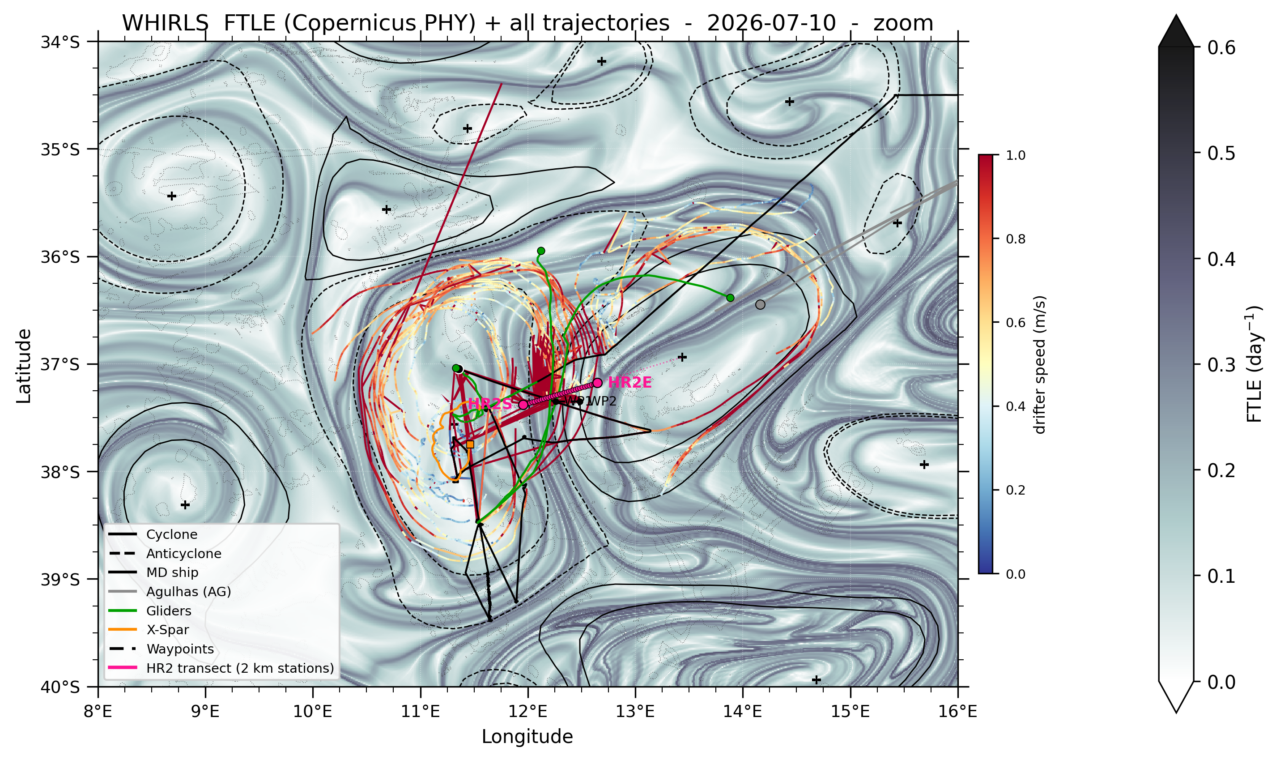
Onto that dynamical picture we layer the observations. Sea surface temperature from several sources, sea surface height, sea surface salinity, and ocean-color chlorophyll each add a different perspective on the same structures, and crucially the platform ingests the new high-resolution observations from the SWOT altimetry mission, which resolves the sharper, finer fronts of the Agulhas system that earlier satellites could not see. Combining these fields lets us cross-check what the flow analyses suggest and spot features that any single sensor would miss.
What the ocean will do next. Because the ship needs to plan ahead, the center also draws on operational forecasts: atmospheric predictions from ECMWF and ocean forecasts from MERCATOR and HYCOM. These let the team anticipate how a target eddy or front is likely to evolve over the coming days, and to weigh ocean conditions against the weather the vessels will actually encounter.
Why it matters. Bringing analyses, satellites, and forecasts together in one operational tool turned a scattered set of data streams into a decision-making instrument. It let the WHIRLS teams target the right eddies at the right moment, coordinate two ships and hundreds of autonomous platforms, and make the most of a rare and expensive window at sea. It is also a template for the kind of observation-driven, near-real-time science that fine-scale oceanography increasingly demands, and a concrete example of what becomes possible when research groups and national data infrastructures such as Data Terra, ODATIS, and AERIS work hand in hand.
As the campaign continues, the ocean keeps swirling, and the map keeps updating.
Featured image: Screenshot of WHIRLS operational center showing live positions of autonomous platforms, the two vessels, and the ocean state.
Author: Sabrina Speich